The foundation of hyper-casual game development is game data, data, and more data.
From testing your very first creatives, all the way to full launch, transparency equips you with fast, reliable information on how to improve and scale your game — ultimately saving you an enormous amount of time and effort. This is why working with a publisher whose top priority is always 100% transparency is a non-negotiable.
CrazyLabs’ CLIK Dashboard is your tool for complete transparency. Below, we dive into our incredibly comprehensive tool with the industry-leading, highest level of transparency across each of the game development testing stages.
Stage 1: Prototype
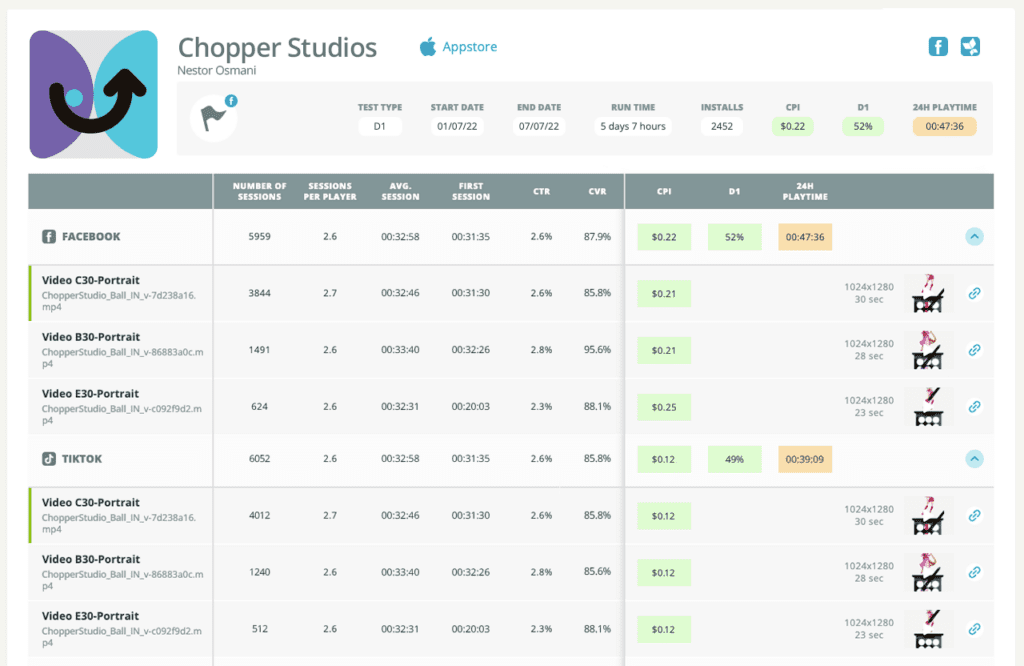
The CLIK Dashboard enables you to run various CPI tests to check the marketability strength of a game idea. We run incredibly granular tests, focusing on both iOS and Android operating systems while testing on FB and TikTok per creative. In some cases, we also run CPI tests on one of the SDK networks, in order to have stronger validation of its marketability strength and to ensure that we’re not dropping a game with potential.
Additionally, although our highest priority in the initial stage of testing is CPI, we will always also test Day 1 and playtime. We do this to make sure that we’re not dropping any games with potential (i.e., games with high CPI and high retention or playtime).
The CLIK Dashboard provides testing metrics like CPI, CVR, CTR, and the number of installs, per creative in real-time. Additionally, the CLIK Dashboard provides you with Day 1 retention and 24-hour playtime metrics when testing CPI.
From this crucial data, you can get a deep understanding of what needs to be improved. For example, low CVR can imply a poor storefront, whereas low CTR is a reflection of an unsuccessful video creative that requires improvement.
Stage 2: Retention Testing
Once the creative video achieves a low CPI, it’s time to focus your attention on building out the initial version of the game, where every level provides different content. We recommend developing a minimum of 30 minutes (depending on the type of subgenre) of original gameplay at this stage.
In the retention stage, we’re testing whether players enjoy playing the game’s various levels so much that they come back the following day to continue playing.
CLIK SDK Data: How you can improve retention by knowing what your game needs
In order for us to gather as much data as possible on your games so that we can understand how players are behaving in your game, we provide you with our proprietary CLIK SDK technology for you to integrate into your game.
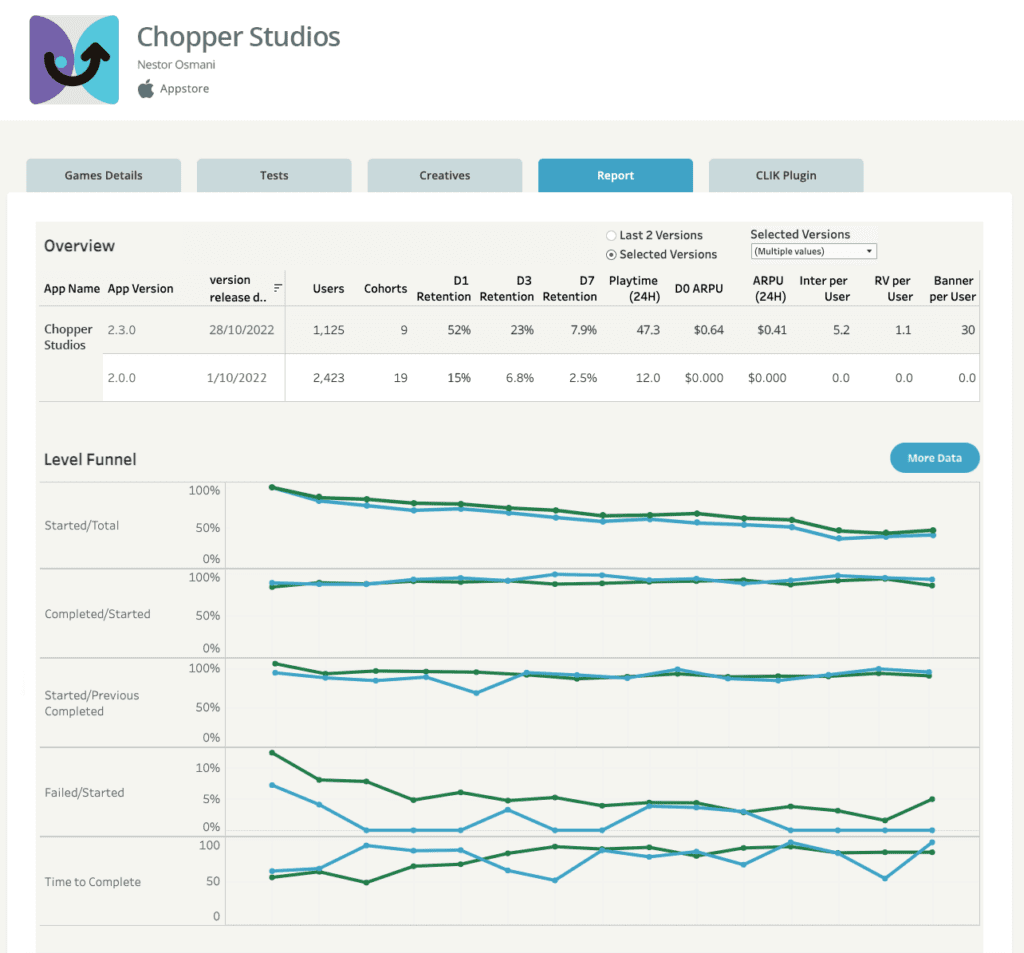
The CLIK SDK is incredibly easy to implement and get started with, providing you with granular data all in one place. The CLIK SDK is a crucial element in transparency since this allows you to understand things like:
- The “Level Funnel” graph charts and tables that show how many players play each level
- Churn charts show at what point in the game users churn, and how they are reacting inside the game
- Time-to-complete: How long does it take to complete each level
- Fail Rate: How many players are failing in each level
- A performance comparison between game versions (i.e., the previous version of the game vs the new version, or on iOS vs GP)
As the CLIK SDK allows you to see everything that’s happening in your game in one place, this makes your life much easier when trying to improve your game’s KPIs and overall performance.
Stage 3: Monetization
After you’ve reached solid CPI and retention KPIs (i.e., Day 1, Day 3, Day 7, and 24-hour playtime), you can start monetizing the game by placing ads inside and testing their performance on different networks (this is called the ARPU stage).
Through the CLIK SDK, you can optimize the ad locations, ultimately improving ARPU. To do this, you need to dive into your game’s below data and make informed changes:
- Where do players see ads?
- How many ads do they see?
- How often are they seeing the ads (i.e., every 30 seconds, etc.)
- Are there any specific ad locations that improved playtime retention or caused churn?
Through this data, you can understand key things like how long the cool down between ads should be, which rewarded video (RV) is performing best and at which level, and how aggressive our ad approach should be. All of this will help make your game become as profitable as possible.
It’s important to note that at this stage it’s also crucial to continue working on the game build to achieve stronger retention and play time (i.e., Day 3, Day 7, 24-hour playtime), which also affects your ARPU.
Stage 4: Scale & full launch
CrazyLabs believes in being 100% transparent about the revenue developers are bringing in from their games. This is why the CLIK Dashboard shows every developer the breakdown of what they’re earning, as transparently as possible;
This includes:
- What is your revenue, UA spend and profit on a daily/weekly/ monthly basis
- What is the game’s total revenue
- How many users were acquired on a daily/weekly/monthly basis
- Which creatives are bringing in the most traffic
- Which operating system is performing better (iOS vs Google Play)
- Which GEO is achieving the highest amount of downloads, and what is the revenue per GEO
A/B Testing
To maintain a game’s profitability, and even increase it, we continue conducting many A/B tests on many groups to ultimately see which level funnel, metagame, storefront, monetization strategy, feature and tons of other elements are performing best.
On the CLIK Dashboard, you’ll be able to see all of this data. Additionally, our developers meet with our LiveOps team on a regular basis to examine all of this data to further optimize your game.
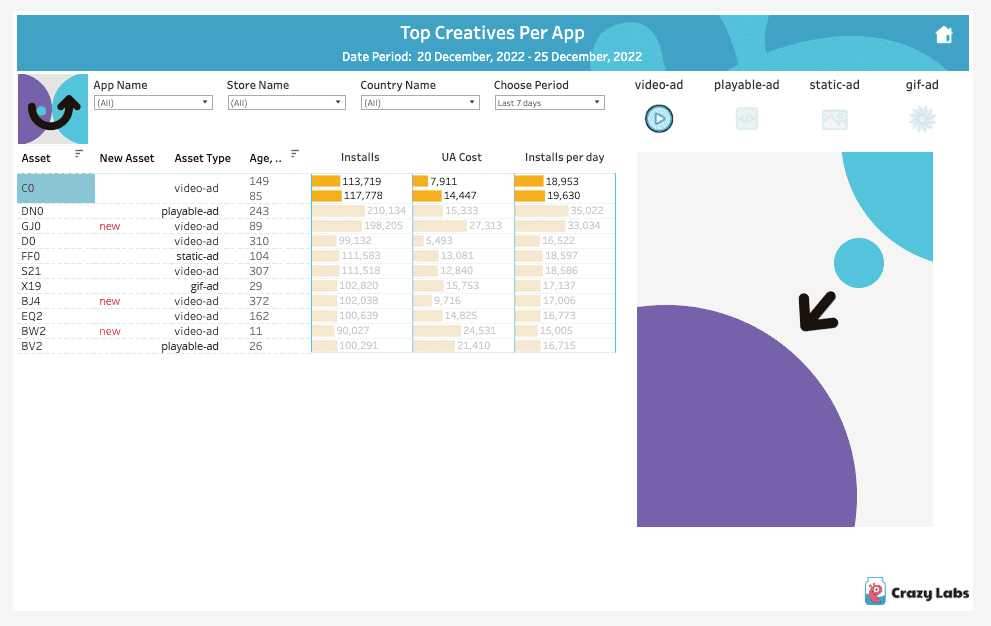
Creative optimization is a never-ending process
Testing and optimizing the creatives is what lets you market your game in the best way possible; you’ll discover this by learning which ads or creatives perform better, and which one is driving the most traffic and revenue. In terms of transparency, the CLIK Dashboard shows you the best-performing creatives per type (video, static banner, end card, and playable creatives).
Build your future with CrazyLabs
Transparent data is what reveals how you can optimize your game, and what worked or didn’t work in your previous games. Every element of transparency you obtain in each game publishing process also pays it forward for next time. In other words, the greater your data, the greater your chances for ongoing success in your future games.
Another important part of data transparency is your learning curve. As a developer, when you can regularly access transparent data and gather actionable insights, you can become a better developer faster and thereby create more successful games.